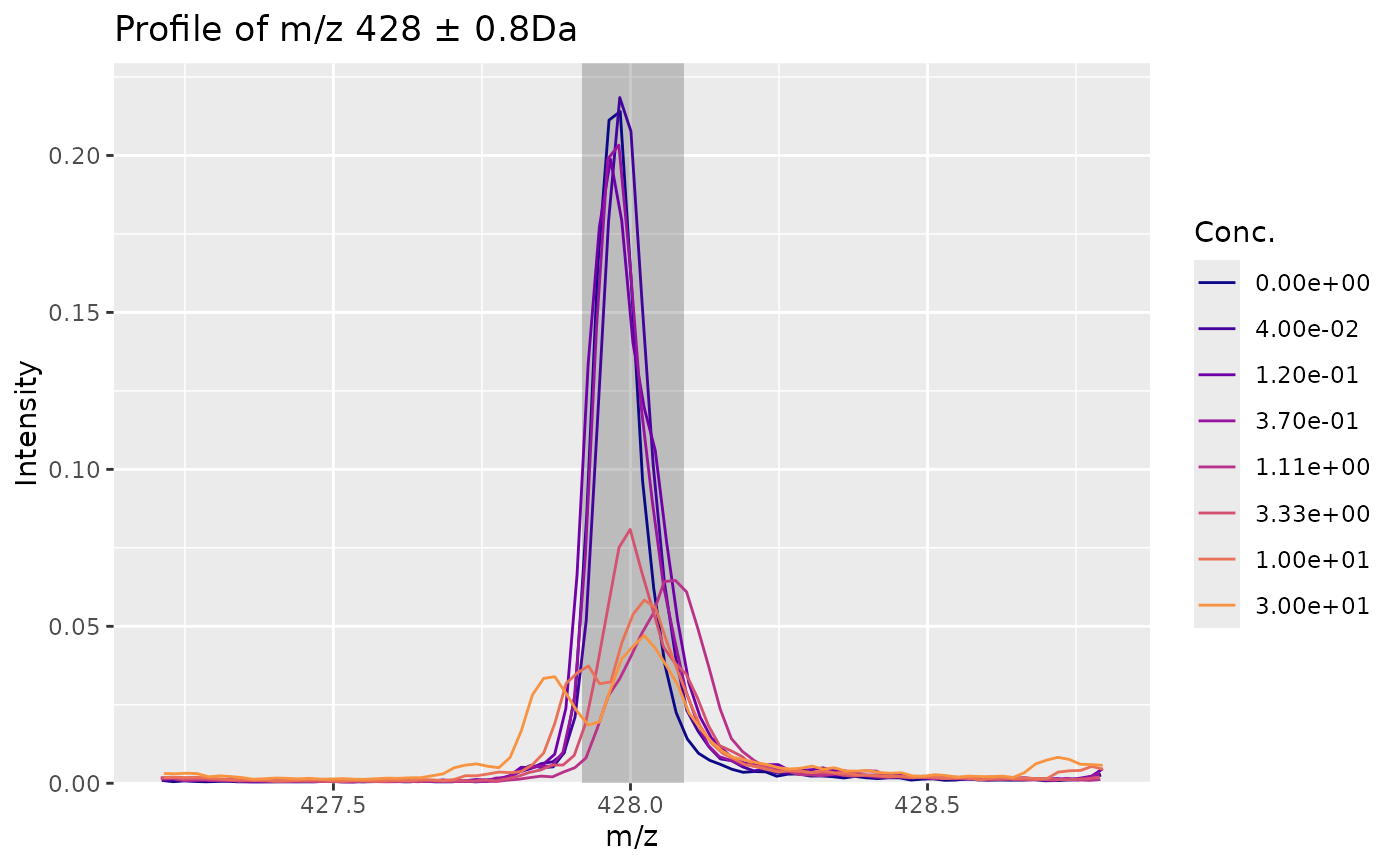
Plot a peak of interest from a MALDIassay object
Arguments
- object
object of class MALDIassay
- mzIdx
numeric, index of mass of interest (see
getPeakStatistics())- tol
numeric, tolerance around peak to plot
Examples
data(Blank2022res)
plotPeak(Blank2022res, mzIdx = 2)