generate ggplot objects for each of the curve fits in a MALDIassay object
Source:R/plotCurves.R
plotCurves.Rdgenerate ggplot objects for each of the curve fits in a MALDIassay object
Usage
plotCurves(object, mzIdx = NULL, errorbars = c("none", "sd", "sem"))Arguments
- object
object of class MALDIassay
- mzIdx
numeric, indicies of mz values to plot (see
getPeakStatistics()). Note, fc_thresh and R2_thresh filters do not apply if mzIdx is set!- errorbars
character, add error bars to plot. Either standard error of the mean (
sem) or standard deviation (sd) in regards to the measurement replicates or no errorbars (none).
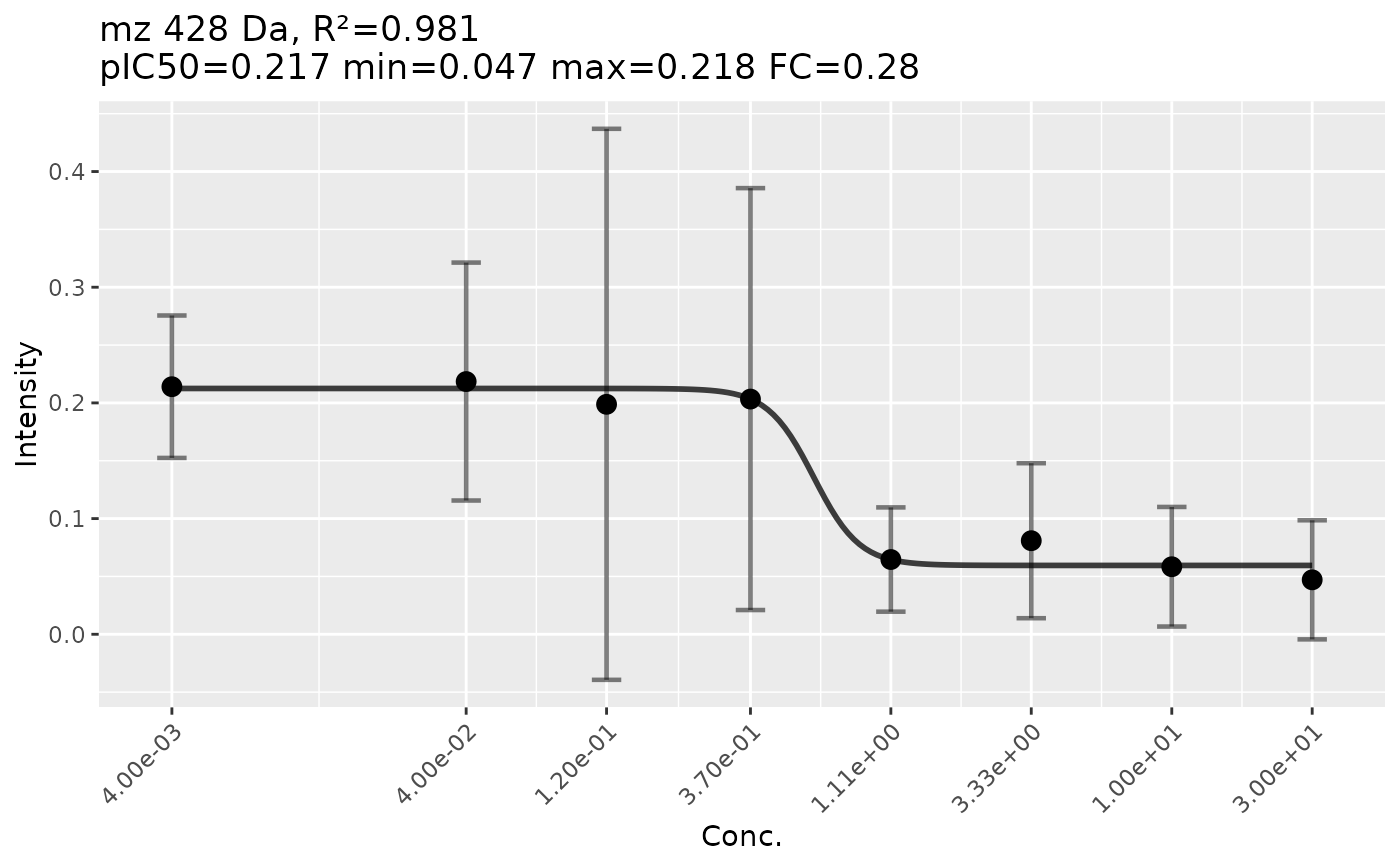
Examples
data(Blank2022res)
plotCurves(Blank2022res, mzIdx = 2, errorbars = "sd")