Check the recalibration of spectra from a MALDIassay object
Source:R/checkRecalibration.R
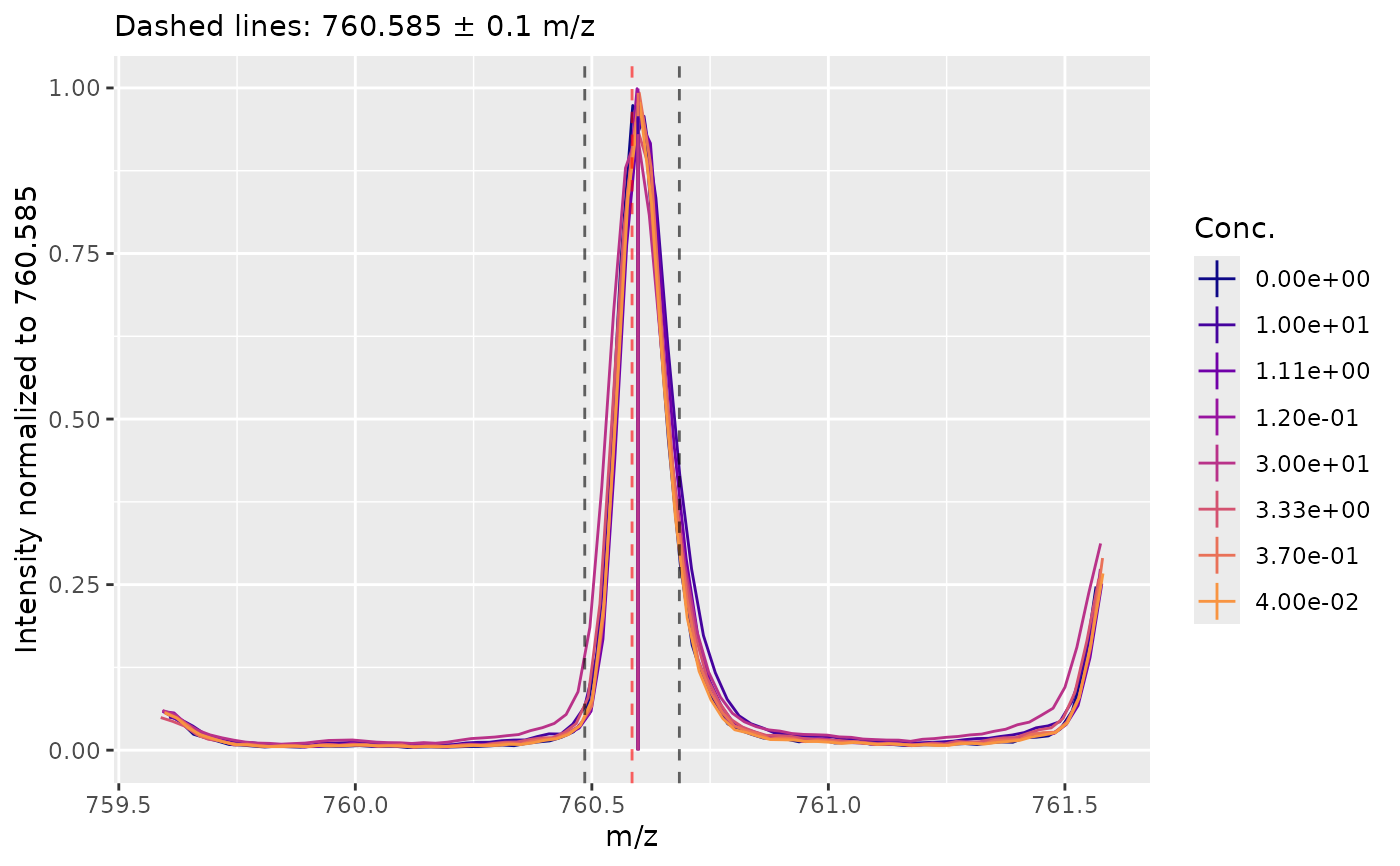
checkRecalibration.RdDashed gray lines indicate the mz used for re-calibration ± the tolerance. Red dashed line indicate the mz used for re-calibration and solid lines indicate peaks. The spectrum will show the peak used for re-calibration ± 10x the tolerance.
Examples
# see example for `fitCurve()` to see how this data was generated
data(Blank2022res)
checkRecalibration(Blank2022res, idx = 1:8)